


Two metrics that answer different questions
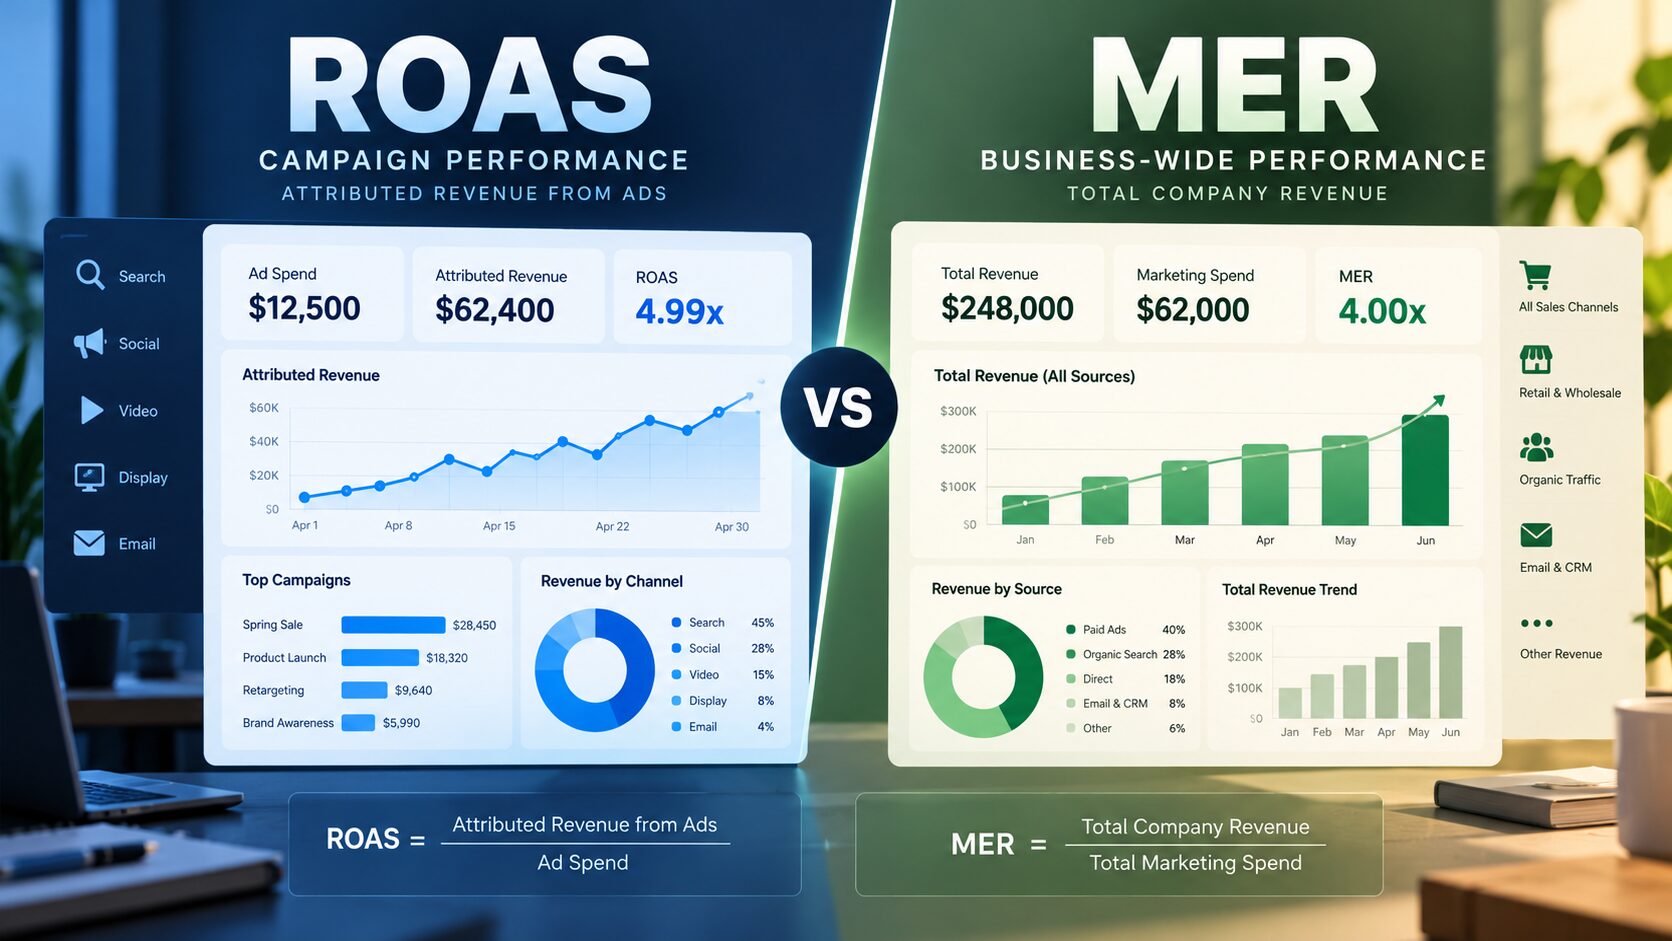
Return on ad spend, or ROAS, is familiar to anyone working in Google Ads or Meta Ads. Marketing efficiency ratio, or MER, is popular among brands looking for a broader view of performance. Both metrics divide a revenue figure by a spend figure, but their scopes differ. ROAS usually compares attributed revenue with the spend on a particular campaign, platform or advertising set. MER generally compares total business revenue with total marketing spend over the same period. Confusing them can lead to confident but flawed decisions.
Neither metric is a complete profitability measure. Revenue is not contribution margin, attributed sales are not necessarily incremental sales, and total revenue can be influenced by factors outside advertising. Rather than declaring one metric superior, effective teams define the decision and select the appropriate level of measurement.
ROAS formula and example
ROAS = attributed advertising revenue / advertising spend. If a campaign spends $10,000 and a platform attributes $50,000 in revenue, its reported ROAS is 5.0, often expressed as 500%. This shows that the platform attributed five dollars of revenue for every advertising dollar spent. It does not prove that five dollars of new revenue would disappear if the ads stopped running.
ROAS is useful for comparing campaign trends, diagnosing changes and managing channels with comparable attribution settings. It becomes less trustworthy when teams compare platforms with different attribution windows, double-count conversions across systems or optimize exclusively toward existing customers who were likely to buy anyway. Attribution models are descriptions of credit assignment, not experiments on causality.
MER formula and example
MER = total revenue / total marketing spend. Imagine a retailer generates $200,000 in monthly revenue while spending $40,000 across paid media, creative production, agencies and other marketing activities included in its agreed definition. MER is 5.0. A second company may define the denominator as paid-media spend only and call it blended ROAS. That difference is important: two teams cannot compare MER without comparing the cost categories they include.
The strongest reporting approach explicitly states which revenue source is used, whether refunds and taxes are excluded, which marketing costs are included and whether periods align. A beautiful dashboard with an undefined denominator is more dangerous than a plain spreadsheet with consistent definitions.
Why the metrics can disagree
Suppose campaign ROAS rises from 4.0 to 6.0 while total revenue remains flat. This may reflect improved attribution, increased remarketing, a change in conversion window or a genuinely more efficient campaign that is too small to move business totals. MER may remain unchanged because spend elsewhere rose or organic demand fell. In another scenario, platform ROAS falls when the company increases prospecting, but overall revenue and repeat-customer acquisition improve. The tactical metric may look worse precisely because the mix shifted toward harder-to-attribute growth.
Seasonality makes interpretation harder. A holiday promotion can lift MER even if the spend created little incremental demand; a product shortage can depress MER even when campaign execution is excellent. Use trends, segmentation and context before attributing company-level changes to a particular ad manager.
Contribution margin changes the interpretation
A ROAS of 4.0 can be excellent for a digital product with very high margins and disastrous for a low-margin retailer with expensive fulfillment and returns. Consider a product sold for $100 with a $45 product cost, $15 fulfillment cost and $5 expected return cost. The pre-marketing contribution is $35. Spending $30 to acquire the order leaves only $5 before overhead and other expenses. If there are agency fees or discounts, that margin may disappear.
Instead of using arbitrary universal ROAS targets, build a break-even model based on gross margin, variable costs, repeat purchases and acquisition economics. Some brands can knowingly accept first-order losses when cohort retention is strong, but that requires evidence of subsequent cash flows rather than a hopeful lifetime-value estimate.
When to use each metric
Use ROAS for tactical monitoring within a specific channel, provided the attribution rules and conversion quality are consistent. Use MER for a business-wide pulse: are overall marketing resources translating into revenue at an acceptable rate? Pair both with contribution margin, CAC, customer retention and cash flow. A CEO usually needs to know whether the business is growing profitably; a campaign operator needs enough resolution to identify what can be improved.
A good weekly dashboard might show revenue, marketing spend, MER, new-customer revenue, CAC and contribution profit, followed by campaign ROAS as a diagnostic breakdown. This hierarchy prevents platform-level metrics from dominating the boardroom narrative.
Example: two strategies, same reported ROAS
Strategy A spends $20,000 targeting previous buyers and reports $120,000 in attributed revenue: ROAS 6.0. Strategy B spends $20,000 on prospecting and reports $80,000: ROAS 4.0. It is tempting to crown Strategy A. But if most existing-customer purchases would have occurred anyway, A’s incremental effect may be small. If B introduces valuable new customers who subsequently return, its incremental contribution may be higher. We cannot know from these numbers alone. We need stronger evidence, ideally a randomized holdout or carefully designed geo test.
The lesson is not to ignore attribution. It is to recognize the boundaries of what attribution can establish. One number cannot answer tactical efficiency, total marketing productivity and causal contribution simultaneously.
A practical reporting checklist
First, define revenue consistently: gross versus net, orders versus invoiced sales, and the treatment of discounts and refunds. Second, define spend categories and attribution windows. Third, segment new versus existing customers where the data is reliable. Fourth, compare figures on the same date basis while accounting for conversion lag. Fifth, review profit and contribution alongside revenue ratios. Finally, conduct incrementality experiments for material budget decisions when feasible.
Set thresholds as discussion triggers rather than automatic verdicts. If MER declines, ask whether the cause was an investment in acquisition, a demand shock, a margin change or poorer execution. If ROAS jumps overnight, investigate tracking and attribution before celebrating. The metrics become useful when they lead to better questions.
Final takeaway
ROAS measures platform-attributed revenue relative to the media spend being evaluated. MER measures broader revenue relative to a defined marketing investment. Both are useful; neither alone proves incremental profitability. Build a measurement system in which tactical attribution, blended efficiency and business profit can challenge one another instead of competing for a single headline number.
FAQ
Is MER the same as blended ROAS? Often the terms overlap, but definitions differ. Can I compare MER across companies? Only cautiously and after normalizing cost and revenue definitions. Is 500% ROAS profitable? That depends on margins, acquisition quality and associated costs. What should a CEO see first? Business revenue, contribution and marketing investment, with campaign metrics available for diagnosis.