Close Menu
Marketingino.comMarketingino.com
    What's Hot

    EBITDA Explained: What It Is, Why It Matters, and When to Ignore It

    20. 5. 2026

    Why Most Side Businesses Never Scale (And How to Fix It)

    20. 5. 2026

    Emotional Intelligence Is Not a Soft Skill. It Is the Skill.

    20. 5. 2026
    Facebook X (Twitter) Instagram
    Facebook Instagram LinkedIn YouTube Bluesky
    Marketingino.comMarketingino.com
    • Home
    • Entrepreneurship
      1. Business Models
      2. Side Hustles
      3. Small Business
      4. Venture Capital
      5. Sustainability & Impact
      6. Startups
      7. Legal & Compliance
      Featured
      Business Models

      EBITDA Explained: What It Is, Why It Matters, and When to Ignore It

      20. 5. 2026
      Recent

      EBITDA Explained: What It Is, Why It Matters, and When to Ignore It

      20. 5. 2026

      Why Most Side Businesses Never Scale (And How to Fix It)

      20. 5. 2026

      Scaling Your Side Hustle: When and How to Turn It Into a Full-Time Business

      6. 2. 2026
    • Marketing
      1. Marketing Strategy
      2. AI & Automation
      3. Social Media
      4. Branding
      5. Content Marketing
      6. SEO & GEO
      7. Growth Marketing
      8. Digital Marketing
      9. Data & Analytics
      10. Customer Experience
      11. Vocabulary
      Featured
      AI & Automation

      Agentic AI in E-commerce: How Autonomous Shopping Is Rewriting the Rules of Retail Media

      20. 5. 2026
      Recent

      Agentic AI in E-commerce: How Autonomous Shopping Is Rewriting the Rules of Retail Media

      20. 5. 2026

      GEO: What Is Generative Engine Optimization and Why It Matters in 2026

      28. 4. 2026

      How to Optimize Your Website for AI Search: A Practical Guide to Getting Cited by ChatGPT, Claude, and Perplexity

      28. 4. 2026
    • Leadership
      1. Coaching & Mentoring
      2. Conflict & Crisis Management
      3. Emotional Intelligence
      4. Executive Mindset
      5. Remote & Hybrid Teams
      6. Team Building
      7. Vision & Strategy
      Featured
      Emotional Intelligence

      Emotional Intelligence Is Not a Soft Skill. It Is the Skill.

      20. 5. 2026
      Recent

      Emotional Intelligence Is Not a Soft Skill. It Is the Skill.

      20. 5. 2026

      Decision-Making Under Uncertainty: What Marketing Leaders Get Wrong and How to Fix It

      28. 4. 2026

      Stay Interviews: Proactively Addressing Employee Needs Before They Leave

      19. 2. 2026
    • Ecommerce
      1. Conversion Optimization
      2. Cross-Border Ecommerce
      3. Customer Retention
      4. D2C & Brands
      5. Ecommerce Marketing
      6. Marketplaces
      7. Online Stores
      8. Payments & Logistics
      Featured
      D2C & Brands

      Recommerce: Why Selling Used Is the Fastest-Growing Channel in E-Commerce

      20. 4. 2026
      Recent

      Recommerce: Why Selling Used Is the Fastest-Growing Channel in E-Commerce

      20. 4. 2026

      Agentic Commerce: How AI Is Taking Over the Shopping Cart

      20. 4. 2026

      The D2C Loyalty Playbook: 6 Tactics That Don’t Require a Single Promo Code

      11. 3. 2026
    • Life
      1. Business Stories
      2. Lifestyle
      3. Net Worth
      4. Travel
      Featured
      Lifestyle

      10 Powerful Reasons 2025 Proved Life Is Getting Better

      31. 12. 2025
      Recent

      10 Powerful Reasons 2025 Proved Life Is Getting Better

      31. 12. 2025

      12 Books to Understand Everything: A Foundation for Universal Knowledge

      3. 12. 2025

      Running in Zone 2: The Secret to Enhanced Work Performance and Productivity

      28. 11. 2025
    Marketingino.comMarketingino.com
    Home»Marketing»Data & Analytics»Data-Ink Ratio: Enhancing Clarity in Data Visualizations
    Data & Analytics

    Data-Ink Ratio: Enhancing Clarity in Data Visualizations

    19. 7. 20243 Mins Read
    Facebook Twitter Pinterest LinkedIn Tumblr Email
    OpenAI
    Share
    Facebook Twitter LinkedIn Pinterest Email

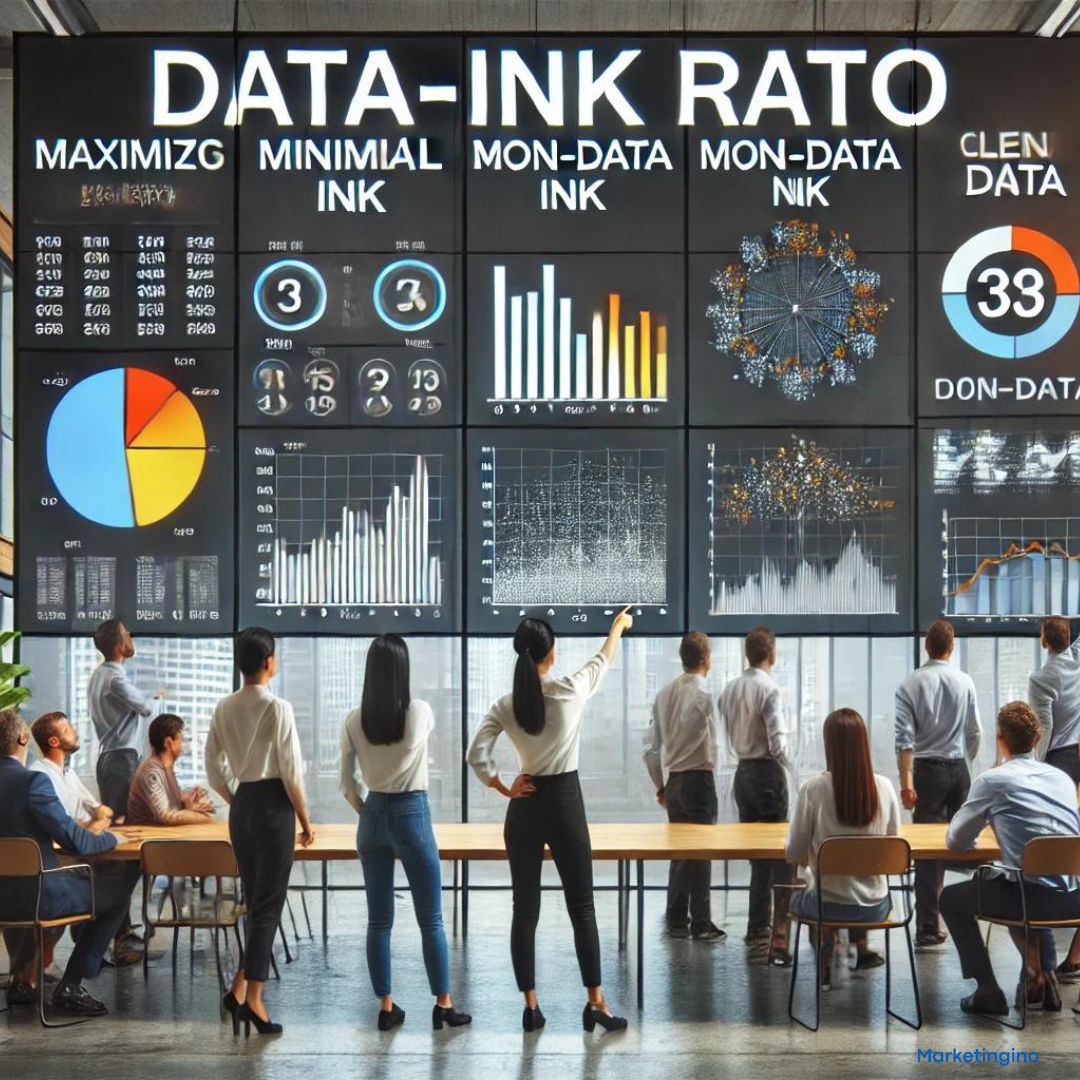
    In the realm of data visualization, clarity is paramount. One crucial concept that significantly contributes to the effectiveness of visual presentations is the data-ink ratio. This metric, introduced by Edward Tufte in his seminal work on information design, measures the proportion of ink (or pixels in digital content) used to display actual data compared to the total amount of ink used in an entire visualization. By maximizing the data-ink ratio, designers and analysts can create clearer, more impactful visualizations.

    Understanding Data-Ink Ratio

    The data-ink ratio is a fundamental principle in the field of data visualization. It emphasizes the importance of focusing on the core data and minimizing any extraneous elements that do not convey meaningful information. In essence, it encourages the removal of “chartjunk” – unnecessary or decorative elements that can distract from the data itself.

    Formula: Data-Ink Ratio = Data Ink / Total Ink

    Where:

    • Data Ink refers to the ink used to represent the actual data.
    • Total Ink is the total ink used in the entire visualization, including non-data elements.

    Why Data-Ink Ratio Matters

    1. Improved Clarity: High data-ink ratio visualizations are clear and easy to understand. They present the data without unnecessary distractions, allowing the audience to focus on the key insights.
    2. Efficient Communication: By reducing non-data ink, visualizations become more efficient in communicating the intended message. This is particularly important in professional settings where time and attention are limited.
    3. Enhanced Professionalism: Clean and minimalist designs often appear more professional. They convey a sense of precision and care in the presentation of data.

    Practical Applications of Data-Ink Ratio

    To maximize the data-ink ratio in your visualizations, consider the following practices:

    1. Remove Unnecessary Elements: Eliminate decorative elements such as excessive gridlines, 3D effects, and background images. Focus on the data itself.
    2. Simplify Design: Use simple, clean lines and shapes to represent data. Avoid using multiple colors and textures that do not add value to the visualization.
    3. Optimize Labels and Legends: Ensure that labels and legends are concise and placed appropriately. They should aid in understanding the data, not clutter the visualization.
    4. Focus on Key Data Points: Highlight the most important data points and trends. Use techniques such as color coding and annotations sparingly to draw attention to these key areas.

    Examples of High Data-Ink Ratio Visualizations

    1. Minimalist Line Charts: A line chart with just the data lines, axis labels, and essential markers. No gridlines, background colors, or 3D effects.
    2. Clean Bar Charts: Bar charts that use solid, simple bars without shadows or gradients. Labels are placed directly on the bars to minimize the need for a legend.
    3. Streamlined Scatter Plots: Scatter plots that use simple dots to represent data points, with minimal axis ticks and labels.

    Challenges and Considerations

    While aiming for a high data-ink ratio, it is essential to balance simplicity with completeness. Over-simplification can lead to the loss of important context and detail. Therefore, designers should strive for a balance where the visualization remains both clear and informative.

    Additionally, different audiences may have varying preferences and requirements. It is crucial to consider the specific needs of your audience when designing visualizations.

    The data-ink ratio is a powerful concept in data visualization, emphasizing clarity and efficiency. By focusing on the essential data and minimizing non-data elements, designers can create visualizations that effectively communicate insights and support data-driven decision-making. As the importance of data visualization continues to grow, mastering the data-ink ratio will be a valuable skill for professionals in various fields.

    Share. Facebook Twitter Pinterest LinkedIn Tumblr Email

    Related Posts

    Why First-Party Data Is the Secret Weapon of Successful D2C Brands

    4. 12. 2025

    How the “Context of Decision-Making” Shapes Our Choices

    16. 7. 2025

    Beyond the Score: How to Measure the Right NPS and Truly Understand Your Customers

    22. 5. 2025

    Is the Pet Industry Outpacing the Kids’ Market in Profitability?

    18. 5. 2025
    Add A Comment
    Leave A Reply Cancel Reply

    Trending

    EBITDA Explained: What It Is, Why It Matters, and When to Ignore It

    20. 5. 2026

    Why Most Side Businesses Never Scale (And How to Fix It)

    20. 5. 2026

    Emotional Intelligence Is Not a Soft Skill. It Is the Skill.

    20. 5. 2026

    Agentic AI in E-commerce: How Autonomous Shopping Is Rewriting the Rules of Retail Media

    20. 5. 2026

    Decision-Making Under Uncertainty: What Marketing Leaders Get Wrong and How to Fix It

    28. 4. 2026

    GEO: What Is Generative Engine Optimization and Why It Matters in 2026

    28. 4. 2026
    About Us

    Marketingino is a modern business magazine for founders, marketers, e-commerce leaders, and innovators who are building what’s next.

    We cover the tools, tactics, and stories driving today’s most ambitious ventures—from early-stage startups to scaling e-shops, from breakthrough marketing strategies to the frontier of AI and automation.

    Email Us: info@marketingino.com

    Marketingino.com
    Facebook Instagram LinkedIn YouTube Bluesky
    • Home
    • Privacy Policy
    • Cookie Policy (EU)
    • Disclaimer
    © 2026 Marketingino.com, © 2026 Vision Projects, s. r. o.

    Type above and press Enter to search. Press Esc to cancel.

    Manage Consent
    To provide the best experiences, we use technologies like cookies to store and/or access device information. Consenting to these technologies will allow us to process data such as browsing behavior or unique IDs on this site. Not consenting or withdrawing consent, may adversely affect certain features and functions.
    Functional Always active
    The technical storage or access is strictly necessary for the legitimate purpose of enabling the use of a specific service explicitly requested by the subscriber or user, or for the sole purpose of carrying out the transmission of a communication over an electronic communications network.
    Preferences
    The technical storage or access is necessary for the legitimate purpose of storing preferences that are not requested by the subscriber or user.
    Statistics
    The technical storage or access that is used exclusively for statistical purposes. The technical storage or access that is used exclusively for anonymous statistical purposes. Without a subpoena, voluntary compliance on the part of your Internet Service Provider, or additional records from a third party, information stored or retrieved for this purpose alone cannot usually be used to identify you.
    Marketing
    The technical storage or access is required to create user profiles to send advertising, or to track the user on a website or across several websites for similar marketing purposes.
    • Manage options
    • Manage services
    • Manage {vendor_count} vendors
    • Read more about these purposes
    View preferences
    • {title}
    • {title}
    • {title}